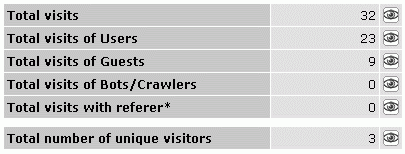
You see a calendar and under it an overview table of all visits to your platform. On the right side there are two additional graphics.
Options: |*| Calendar: Choose the desired Tag, Month or Year.
|*| view daily / monthly / yearly Here you can change the time intervals for the calendar. Click on the red link view to the left.
|*| search visits: Here you can filter visits by specific time intervals. Click on the red link search visits to the left.
|*| Visits view: Click
on an eye in the overview table on the eye to the right. The Visits
view is opened. Here you can see each single visit of the choosen
period and group of people.
Overview table amount of visits
|*| Browser chart: The
data in the right graphic demolish its small size very fast. Click on
the diagram to display the complete data in a readable size.